Data Collections Strategies in Education
Few subjects elicit the type of polarized reactions that data commonly does. Somewhat unsurprisingly, its a source of dread for those who fear flashbacks of middle school algebra. To those (somewhat less common) enthusiasts however, it represents a boon of untapped knowledge and understanding just waiting to be utilized.
From apathy to advocacy, evolving our relationship with data, including our sense of ease around it, is going to be an inevitable part of the coming digital transformation.
As an educator, you may not need to be fluent in complex ideas like data latency, concurrency, et al (though there are many amazing courses for that), but you likely want to be able to hold up your end of a conversation. You want to understand both the process for collecting actionable data at your institution and how you can leverage it to make iterative classroom improvements.
This three-part series offers an exploration of data in higher learning and is meant as a primer for educators and administrators who are looking to take the next steps in building data ready classrooms of the future.
In it we provide layman’s overview of terms in data science where they regard common educational approaches for collecting and utilizing data.
“If advancements in how we understand and utilize data have the same impact on learner outcomes as other sectors, the next decade will represent the most explosive period of educational growth in a century.” ~JPS Kohli, CEO – Skill-Up Technologies
How Schools Can Get Started with Data
It’s important to know that we’re just beginning to scratch the surface of what data can offer us in the way of improved learner outcomes. Part of the challenge with big data is that it’s…. well…. BIG. It has so many applications that it’s not always clear what we should be focusing on. Student success is the ultimate goal, but bench-marking progress towards this goal isn’t always easy without a specific framework within which to think about it.
That means that our first steps in creating actionable metrics will be plotting out our method for collecting and utilizing it.
Your Data Roadmap
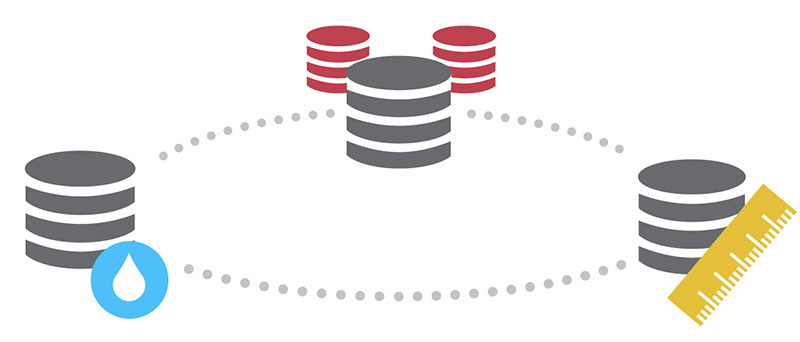
A great data strategy lays out a roadmap for the collection, analysis and utilization of incoming data. To be effective, your data strategy should be consistent across the organization and include the following components:
- Data Hygiene – Data hygiene defines the process by which data is collected and reviewed. Our goal is to ensure clean data that isn’t affected by potential outliers such as duplicate records, incomplete, or outdated data.
- Data Warehousing – Data warehousing refers to your institution’s process of storing and working with that data.
- Data Measurement – Data measurement refers to your plan for ensuring that the data you’re using is the data that matters.
Without the right data strategy, it’s easy to become overwhelmed, lose sight of the overarching goals, mismanage data, or allow data and analytics to be lost or siloed within a single department or job title. Data strategy keeps everyone on track.
Choosing the Right KPIs to Monitor in Education
To build meaningful “apples to apples” comparison about which methods are proving the most effective at moving the needle, educators should come to the table with a consistent set of performance indicators
Be careful here: KPIs can – and often do – vary between institutions, campuses, and even departments. For example, while stakeholders in the chemistry department may be focused on tracking online lab time, as it relates to success rates, teachers in the archaeology wing, may be looking to track specimens cataloged as it relates to comprehension of materials.
A great rule of thumb is to start with your conclusion. Any data that will contribute to that conclusion should be measured under the same scale.
In either case, the organization’s stakeholders should thoughtfully consider what measurements mean the most to them. That is, “which data more dramatically impacts my decisions to move forward?” Sometimes, this isn’t immediately obvious. Some organizations begin obtaining data first and look for viable applications and trends later. Still, crafting a preliminary roadmap is helpful.
Educational institutions can get useful information from the following KPIs (key performance indicators), although there are hundreds and possibly thousands of variables that can be tracked in any curriculum:
- Percentage of online/in-person courses
- Time spent viewing and engaging with a specific materials
- Grades in online courses
- Completion of media-rich viewing
- Progress toward milestones
- Online vs. in-person courses attended
Rome wasn’t built in a day and your data strategy likely won’t be either. Remember to start with clear measurement plan. Consider what your most important indicators are. See where you’re challenges are and build from there. On the next blog in this series, we’ll talk about the digitally connected classroom: How educational institutions can collect and process real time classroom data.